Cross-Country Soaring 2004
![]() User Guide
User Guide ![]()
12. Automated Glider Performance Test
Knowing a glider’s performance characteristics can help a pilot maximize his flight in whatever way he chooses (e.g., time aloft, altitude gained, distance flown, or average course speed). A pilot typically wants to know about at least two “cardinal” speeds of the glider, minimum sink and best glide. Starting with Version 4.0, CCS 2004 offers the facilities to conduct an automated glider performance test in order to determine the glider’s performance curve equation, or “polar”, including minimum sink and best glide. The user basically just tells CCS three airspeeds to use as data points, and CCS performs the flight test, collects the data, and creates a file containing the results of the test. This facility can be used by designers to speed up the tweak-test-tweak-test cycle of refining a glider’s performance characteristics. It can also be used by the rest of us to determine the polar coefficients needed by the LNAV flight computer or simply to determine minimum sink and best glide.
To determine a glider’s polar coefficients, the sink rates at three airspeeds must be known. The flight test will seek out each of these three airspeeds and will measure and record the sink rate at each airspeed. To best describe the glider’s performance in the speed range in which you expect to typically fly, pick speeds within this range. For example, I typically fly my hang glider in the 18-40 mph range, so I might choose airspeeds of 18, 29, and 40 mph. Choose the three airspeeds at which you want to collect data.
Performing an Automated Glider Performance Test
1. Start FS, and put the glider in level flight in the configuration (e.g., any desired ballast, gear up, flaps retracted) at which you want to determine its performance. Place the glider in a location where the terrain elevation straight ahead for five miles or so is 1,500’ MSL or less. If you plan to conduct multiple flight tests, then you might want to save the flight at this point (in order to re-use it later). For the flight test to take the least amount of time, make the glider’s airspeed near test airspeed #1.
2. Determine the desired test airspeeds you want to use. You will likely find that test results will vary depending on the test airspeeds used. This is due to the polar equation’s inability to exactly describe the performance of a real aircraft. The polar equation will give exactly the correct sink rate only for the three test airspeeds used. Therefore, you may want to test at the three airspeeds you expect to use most often (e.g., minimum sink, best glide, and whatever speed your flight computer says you should fly given the thermal conditions in which you typically fly). You can guess at these airspeeds for the first test, and then use the test results to refine the speeds (minimum sink and best glide, anyway). Then run the test again.
3.
Start the CCS Control Panel program, select Test Glider Performance mode, and click
Configure. You’ll see the Test Airspeeds 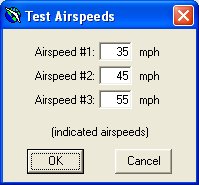 window.
4. Enter the desired airspeeds in the Test Airspeeds window, and click OK.
5. Click Exit and Launch Cross-Country Soaring.
6. After your aircraft position has stabilized in FS, click OK. It is recommended that you wait to click OK until your hard drive activity slows to normal, if it is active after starting CCS.
7. Do not minimize FS during the test. This could cause the test to produce bad results.
8. During the test, CCS will write certain progress messages to the FS screen.
9. When the test completes, click OK to the “complete” message. CCS will automatically exit.
More about the Automated Glider Performance Test
The test basically acts as an elevator-only autopilot. It controls airspeed using only elevator control (no elevator trim control) and collects sink rate data at each of the three test airspeeds. Once test airspeed #1 is reached (+/- 1%) and is stable, the test will collect one airspeed and sink rate data point every two seconds for 20 seconds. It averages these ten data points in order to minimize the effect of any small pitch oscillation occurring at the time of data collection. This process is then repeated for airspeeds #2 and #3.
The flight test also controls altitude somewhat. As soon as CCS is started, the glider is moved to an altitude of 3,000’ MSL. Once the first test airspeed is reached, the glider will be moved to 3,000’ again (unless higher than 2,800’ already) before data collection begins. This move to 3,000’ will occur just before data collection for each of the three test airspeeds. This causes each collected data point to occur at roughly the same altitude. Altitude above ground level (AGL) is also continuously monitored, and if the glider descends below 200’ AGL, it will be instantly moved to 3,000’ MSL. This helps avoid an accidental collision with the ground during the test.
At the end of the flight test, CCS creates a file named polar.dat in your CCS program folder. This file contains the data collected during the test, the polar coefficients calculated using this data, and the minimum sink and best glide conditions calculated using these polar coefficients. Below is an example of the contents of the polar.dat file.
|
Flight Test Data: Indicated Airspeed Sink Rate Glide Ratio
------------------------------------------------ mph
km/h fpm m/s
L/D
------------------------------------------------ 28.2
45.5 208 1.06
11.9 30.8
49.7 215 1.09
12.6 44.7
72.1 444 2.26
8.9 Polar Equation: y = (A *
x^2) + (B * x) + C Coefficients (y in fpm, x
in mph): (negative y = descent) A = -0.830005345 B = 46.242795885 C = -851.975125431 Coefficients (y in m/s, x
in km/h): (negative y = descent) A = -0.001620795 B = 0.145646351 C = -4.328034609 Maximum L/D: 12.7 @ 51.7
km/h (32.1 mph) Minimum sink: 1.06 m/s @
44.9 km/h 208 fpm @ 27.8 mph |